Euronext NV (ENX.FP)
A core European market infrastructure asset is available at "for sale" prices
Disclosures
I and/or others I advise hold a material investment in Euronext. Everything expressed here is only my own opinion, it should not be relied upon, nor should be considered investment advice. Always do your own independent research.
Background
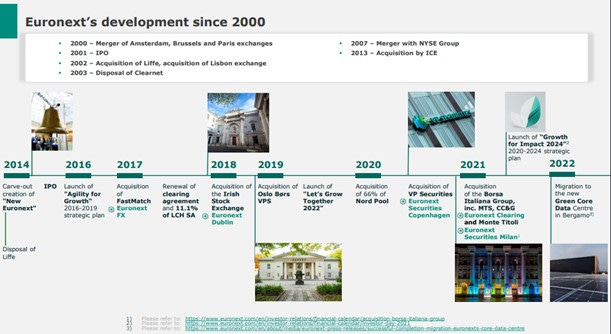
Euronext was spun out of Intercontinental Exchange (ICE) in 2014 as a relatively unexciting exchange with heavy exposure to the competitive cash equity business.
Under the helm of its talented CEO, the business has been transformed through M&A into a leading pan-European market infrastructure asset: today the group operates 7 national exchanges in Europe and has diversified away from cash equities into less volatile and more valuable post-trading activities (clearing and settlement), listing and technology businesses.
The most recent acquisition of Borsa Italiana in 2021 is a real game changer for the group as it provides it with its own independent multi-asset clearing house - a highly attractive asset.
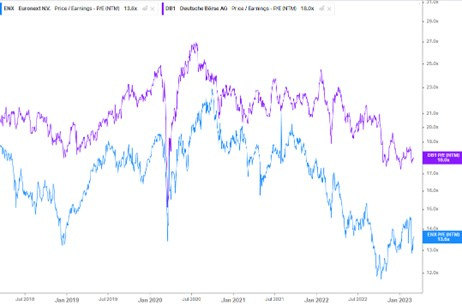
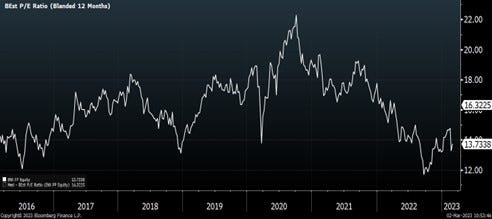
The market is yet to fully appreciate these changes as Euronext stock trades on an undemanding 14x P/E, at a significant discount to European and US exchange peers and at trough relative to Euronext own’s history.
Summary Investment Thesis
Euronext is a high returns franchise: Euronext is a high return market infrastructure franchise (5-year CFROI of 27%) benefiting from network effects, high and stable margins (55-60% EBITDA margins) and consistent strong cash generation (5-year average cash conversion of 90%).
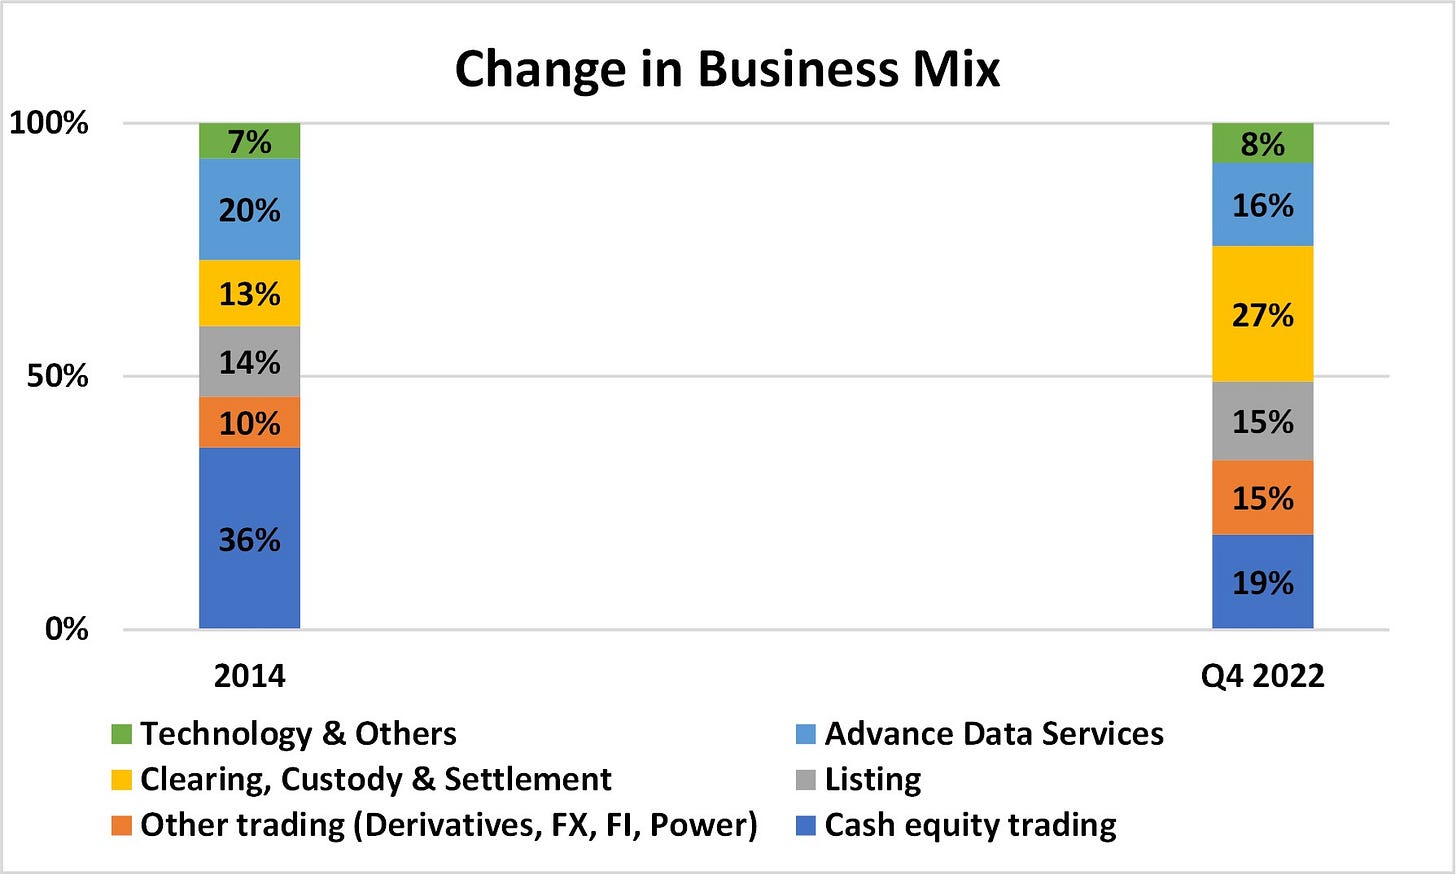
Diversified away from cash equity business: following a series of acquisitions, Euronext is no longer primarily a cash equities business (19% of group revenues vs >35% in 2014), but rather it transformed into a valuable market infrastructure asset that operates different products (fixed income, derivatives, indices) and offers a wide variety of services (listings, custody, clearing, connectivity services).
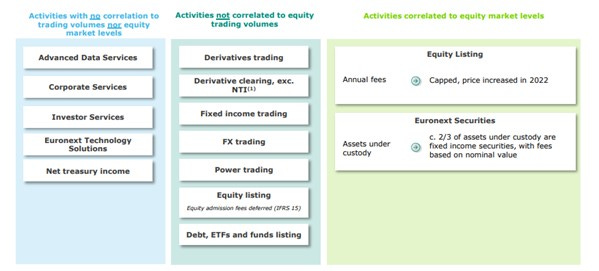
Non-volume revenues significantly increased: today Euronext generates 60% of group revenues from non-volume related activities (ie not linked to trading), at a similar level to competitor exchange Deutsche Börse, which trades on much higher multiples.
Potential for further capital deployment: investors aren’t giving credit to Euronext for its B/S firepower which will most likely be deployed into M&A with the goal to lift the group overall organic growth rate and diversify further.
Attractive valuation: both on an absolute basis and relative to peers and history, Euronext trades on highly attractive multiples; the FY23 P/E of 14x and FCF yield of 7-8% appears generous for an asset of this importance in Europe.
Key Attractions/Positives
European exchange of reference benefiting from network effects: Euronext owns and operates 7 national exchanges (France, Italy, Ireland, Netherlands, Belgium, Norway and Portugal) and it is therefore the exchange group of reference in Europe; it controls 60-65% market share across its owned exchanges, benefitting from network effects - no trading house can operate in Europe without paying for access to Euronext markets.
Much improved revenue exposures: non-trading related activities (listing, custody, clearing, connectivity services) account for 60% of group revenues and benefit from pricing power (pricing will rise mid-single digit in 2023); conversely the more competitive cash equity business is reduced to 19% of the group (from >35%) and likely generates good cashflows given its high market share (>60%).
Strong management team and execution: CEO Stephane Boujnah transformed the group into a diversified market infrastructure asset through acquisitions, generating +11% FCFE/share CAGR over 2014-22, whilst maintaining modest financial leverage (2.4x net debt/EBITDA in FY22).
Defensive asset: in 2009 revenues dropped -20% driven by cash trading down -45%, yet the group remained profitable and cash generative; today Euronext is more diversified and significantly less reliant on cash equity trading than in the past.
Regulatory tailwinds: following Brexit, the EU has been actively trying to capture business from London and in certain strategic areas of European financial markets (derivatives clearing is an example); Euronext is ideally placed to benefit from this trend given its relatively small size and track record of successful deal execution and integration.
Key Risks/Negatives
Cash equity remains a competitive business: Euronext still generates c.19% of group revenues from cash equity trading which remains a highly competitive business.
Acquisitive strategies are riskier: despite a successful track record in integrating assets and over-delivering on targeted synergies, Euronext’s acquisitive growth strategy carries higher risk than a pure organic growth strategy.
Disruption and Cyber-risk: Euronext and exchanges in general are effectively technology companies at risk of cyber-attacks and/or technological disruption.
Regulatory risk: market failures and/or disruption could lead to regulatory changes that could impact the exchange industry.
Investment Case in Charts
Management acquisition strategy generated sector-leading TSR since 2014 and repositioned the group into a diversified set of businesses with several growth opportunities on which to capitalize on.
Euronext cash equities business is under 20% of the group, whereas stickier, non-volume related revenues have grown to reach 60% of the total group sales.
Euronext’s mix of non-transactional revenues is comparable to premier exchange Deutsche Börse who trades on higher multiples.
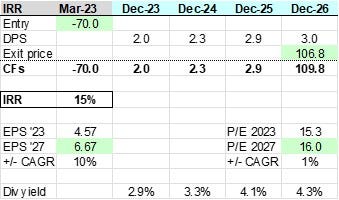
Assuming a normalization back to the median historic multiple of 16x, an investment in Euronext could generate an IRR in the mid-teens, without assuming any additional value creation from the potential capital deployment into further M&A (today, net debt/EBITDA is c.2.4x).
Structure of this Write-up:
Brief History
Why the Opportunity Exists
Key Exposures
Industry Context
Euronext Strategy & Business Model
Divisional review
Management & Remuneration Policies
Financial Algorithm
Capital Allocation
Historic TSR
Valuation & IRR
Shareholders
Main sources: company reports, transcripts, Redburn, CS HOLT, Bloomberg, Value Investor Club writeups.
1. Brief History
In the 1990ies national exchanges were demutualized and listed, triggering a wave of mergers in the 2000s:
Euronext was formed in 2000 through the merger of the Brussel, Amsterdam and Paris stock exchanges.
In 2001, the company acquired LIFE (London International Financial Futures and Options exchange), the crown jewel derivatives exchange in Europe.
In 2007, NYSE acquired Euronext for €10bn, competing against NASDAQ and Deutsche Börse.
In 2013 Intercontinental Exchange (ICE) acquired NYSE-Euronext, but eventually spun off the European continental exchange, retaining ownership of LIFE, the derivative exchange.
In June 2014, Euronext returned to public markets with a market cap of only €1.4bn (compared to today’s €8bn).
At IPO Euronext was heavily exposed to cash equities and operated 4 national European exchanges.
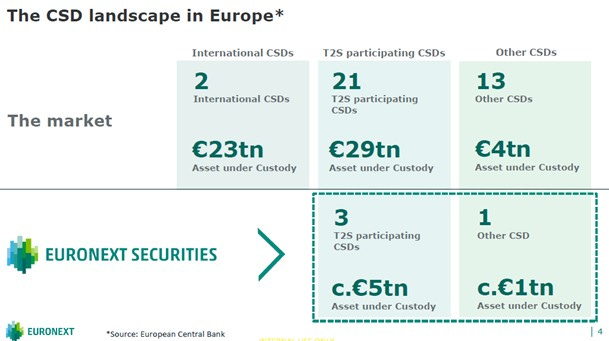
Fast forward to 2022, through several acquisitions, Euronext became a premier market infrastructure asset operating 7 national European exchanges, several non-equities platforms (fixed income, FX and derivatives), and owns a large post-trade business made up of a multi-asset clearing house and the third largest CSD network in Europe.
Over 2014-22 Euronext grew EPS and FCF/share grew by +11% p.a, whilst maintaining a reasonable level of financial leverage (2.4x as of Q4 2022).
2. Why the Opportunity Exists
The stock is today trading at a low multiple FY23 P/E of 14x, c.7-8% FCF yield, whilst paying an attractive dividend yield of 3%.
There are several potential reasons why the stock may be mispriced:
Sell-side analysts have a myopic focus on the cash equity business, which attracts the majority of questions during conference calls and is considered a low quality asset; however the cash equities business is only 19% of group revenues (compared to nearly 40% in 2014) and will continue to shrink as a proportion of the overall group due to its slower growth relative to the other faster growing segments.
The market isn’t fully appreciating that Euronext generates 60% of group revenues from non-volume related businesses in line with peer Deutsche Börse which trades on > 4x higher P/E points, around 18x.
Euronext is active in the M&A arena in Europe, which clearly carries with it higher risks than a pure organic growth strategy; having said, the management team has a solid track record of creating value for shareholders via M&A and often over-delivered on deal synergies (Borsa Italiana’s synergies were recently upgraded to €115mn, nearly double the original target of €60mn in 2019). The company isn’t fully credited for being run by a talented management team with a track record of value creation, having generated FCF/share growth of +11% p.a since 2014.
Paradoxically, despite generating the best TSR since IPO in 2014 amongst its peer group (+21% p.a), Euronext remains by far the cheapest stock in the stock exchange universe in Europe.
3. Key Exposures
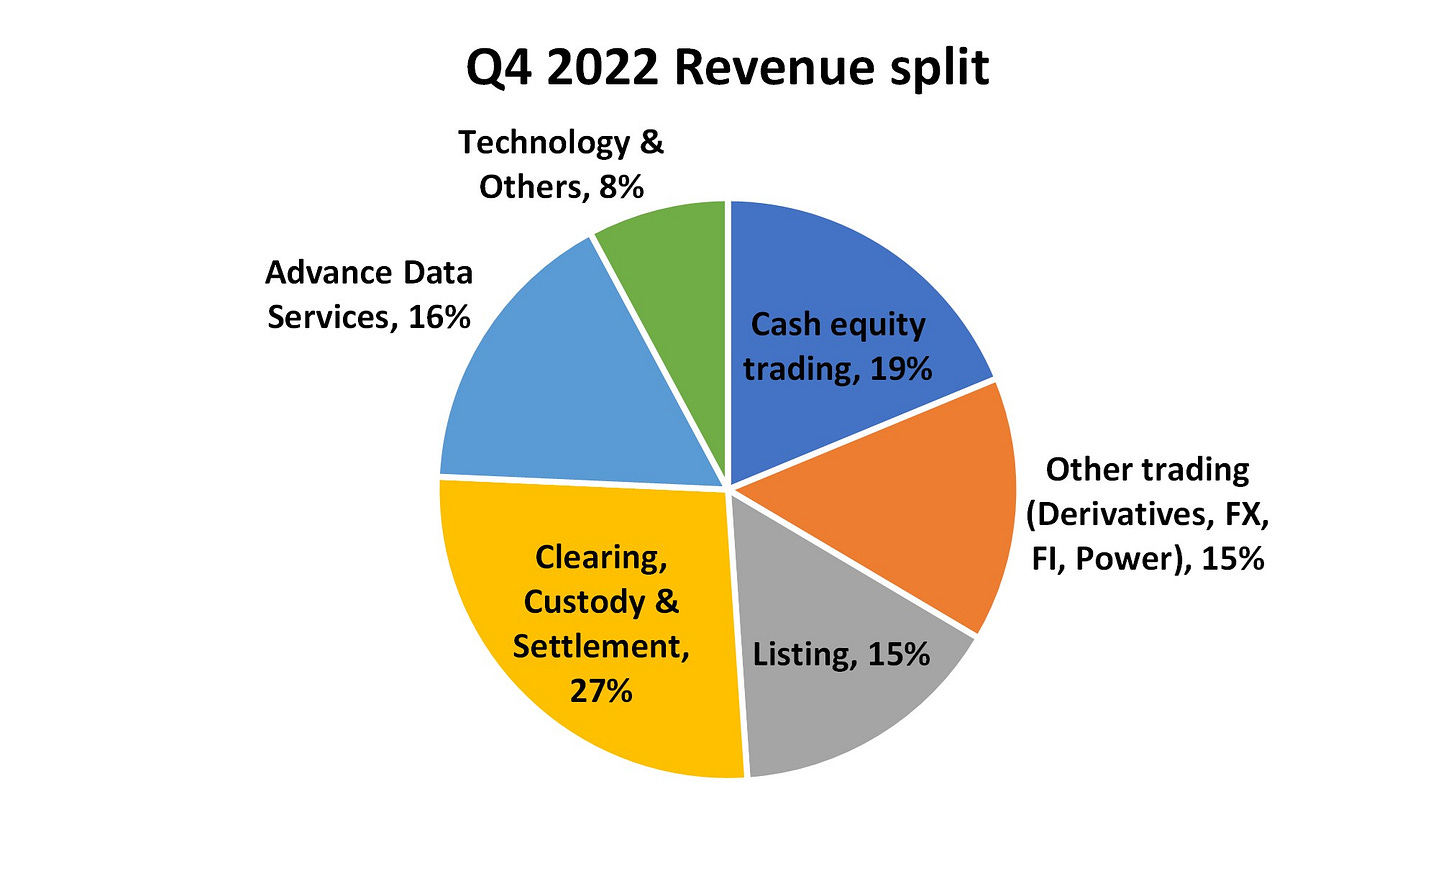
As of Q4 2022, Euronext revenue exposure can be split in 6 different groups/verticals:
Clearing, Custody and Settlement revenues (27% of group) - primarily post-trading related revenues.
Cash Equity Trading revenues (19%).
Advance Data Services revenues (16%) - primarily indices and raw-data subscription revenues.
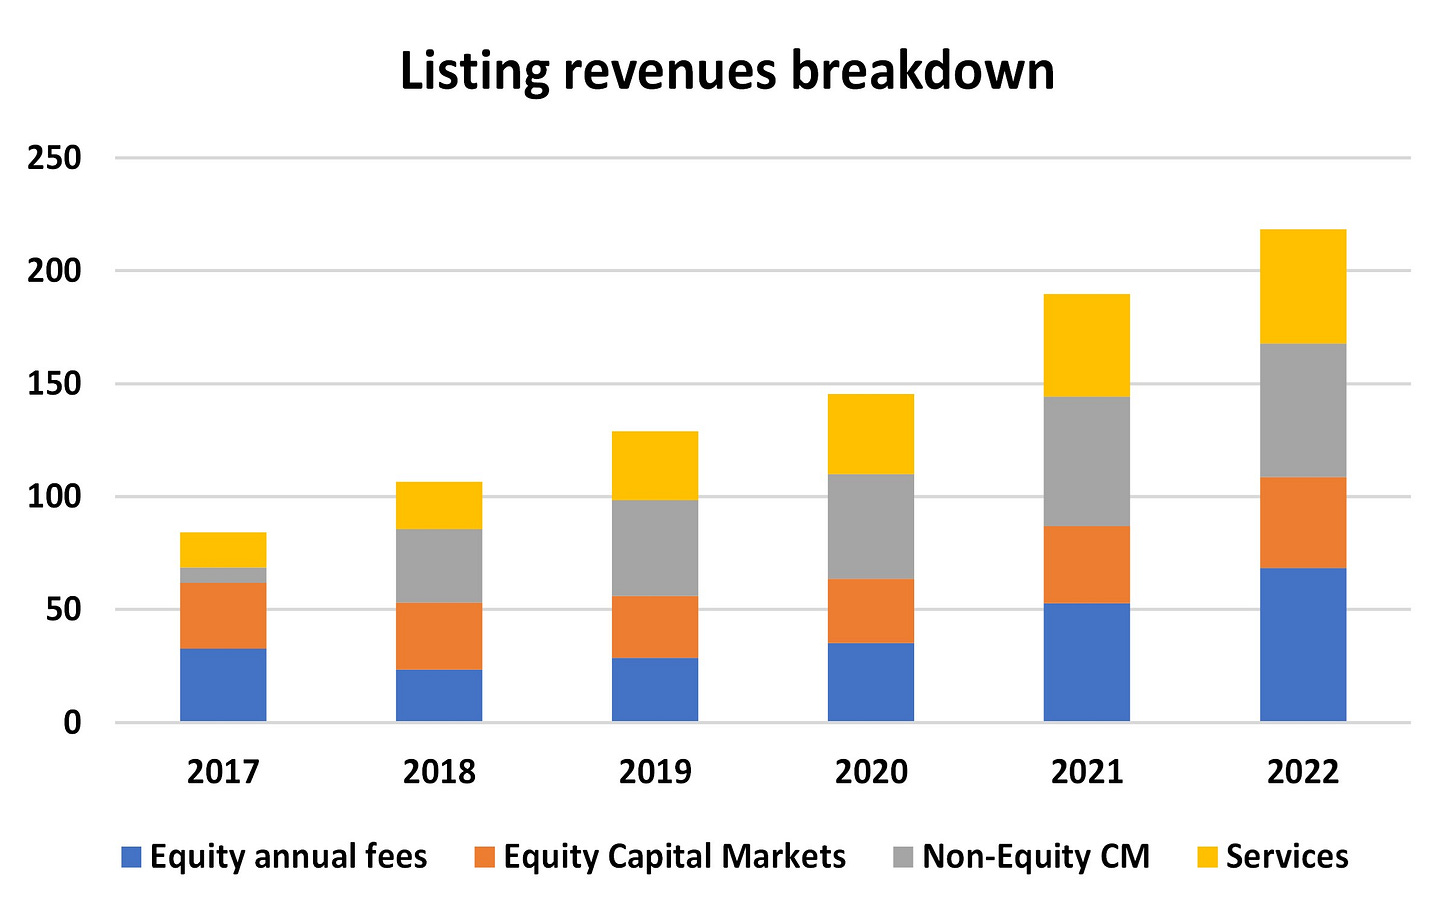
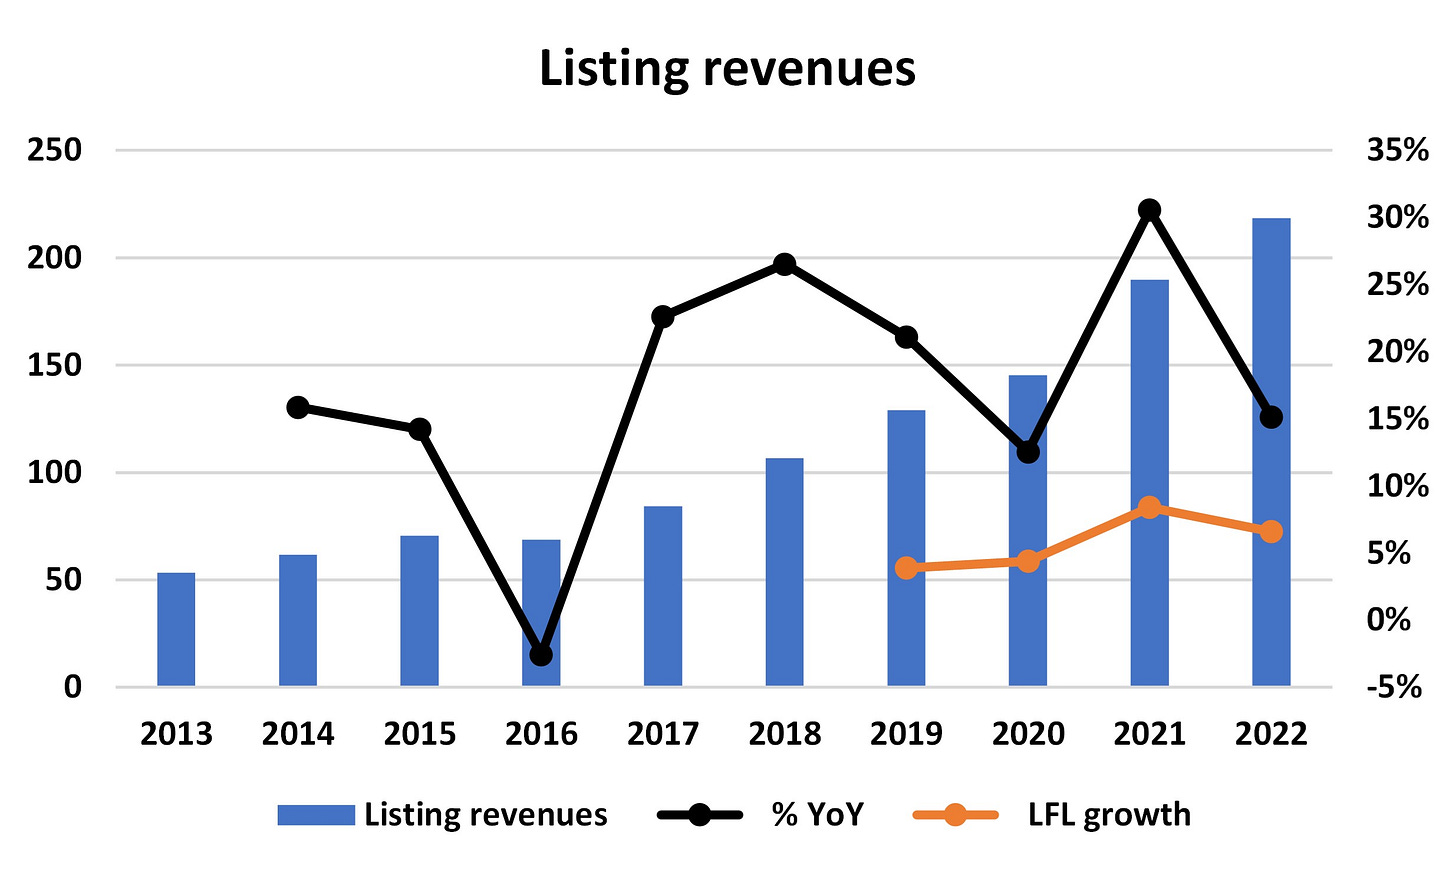
Listing revenues (15%) - only part of this business is linked to equity capital markets activity levels, there are some a-cyclical services offered by this business.
Other trading revenues (15%) - originating from derivatives, fixed income, FX and Power trading.
Technology and Others revenues (8%) - colocation and software sales.
As of Q4 2022, Euronext non-volume related revenues accounted for 60% of the group; the more competitive cash equity trading revenues accounts for 19% of group as of Q4 2022 compared to >35% at IPO.
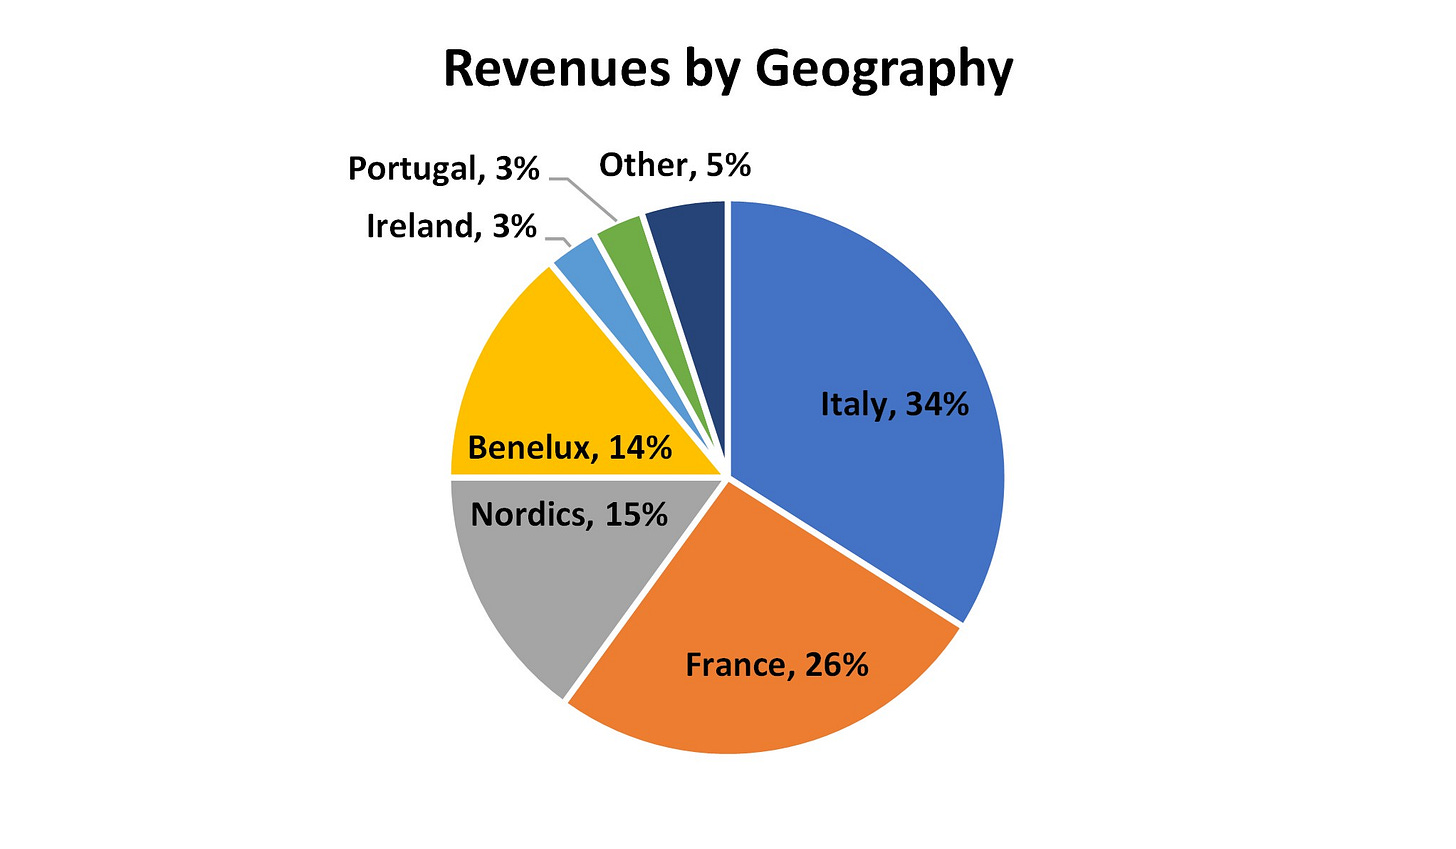
From a geographic standpoint, following the acquisition of Borsa Italiana in 2019, circa 35% of group revenues originates from Italy, followed by France (25%), the Nordics (15%) and Benelux (15%).
4. Industry Context
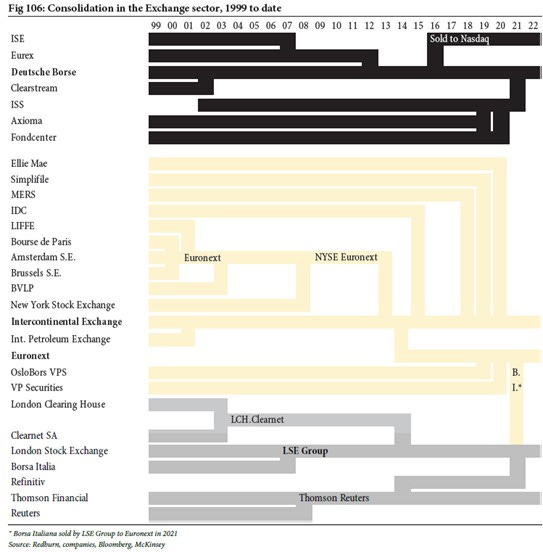
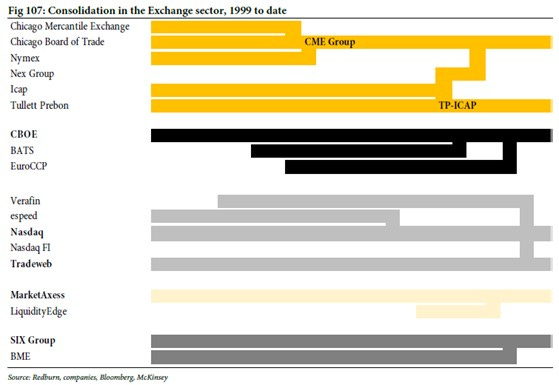
Over the last two decades the exchange sector experienced several waves of consolidation, both in Europe and in the US, leading to very few remaining operators dominating the industry.
In Europe, the largest and premier assets are the London Stock Exchange Group ($50bn market cap) and Deutsche Börse ($32bn), whereas Euronext is a smaller, less global player ($8bn).
In the US, the largest exchanges are Chicago Mercantile ($66bbn), Intercontinental Exchange ($57bn), Nasdaq ($27bn) and CBOE ($13bn). Some US exchanges such as ICE and CBOE run meaningful operations in Europe.
In general exchanges and market infrastructure operators are high quality assets displaying attractive characteristics such as:
High barriers to entry in the form of IP/technology, regulation and network effects driving a winner-take-all dynamic in specific products (as orders tend to concentrate in the most liquid market).
High margins and limited capital intensity driving high returns on invested capital.
Whilst cyclical, exchanges benefit from defensive attributes as revenues tend to correlate positively with levels of markets and economic volatility.
Exchanges aren’t sleepy, slow growing businesses, quite the opposite: in the last 20 years, trading volumes on exchanges have grown significantly, benefiting from two important structural growth drivers (1) the increased electronification of capital markets, (2) the high level of innovation and increase in risk sophistication of investors.
Over 2010-21, industry transaction revenues grew at an average compound growth rate of +7%.
Exchanges cleverly reinvested the excess FCF coming from their growing trading revenues into developing new business lines based on the proliferation of data generated on their platforms.
Over time, the provision of data and financial information became a second major source of revenue growth for the exchange industry globally.
Investors consider non-trading related revenues as of “higher quality” as they tend to be contractual and recurring, offering greater stability and stronger pricing power than trading related revenues.
Considering this context, the major listed players in Europe are:
London Stock Exchange Group ($50bn market cap): one of the leading infrastructure and data group globally, following the acquisition of Refinitiv in 2019; LSE is the listed exchange with the lowest exposure to trading businesses (25% of group revenues) and the greatest exposure to recurring subscription-based data businesses (75% of group).
Deutsche Börse ($32bn): a diversified operator of trading and post-trading assets in Europe, with strong gearing to derivatives products and clearing related activities.
Euronext by comparison is a smaller entity ($7bn market cap), but this does not need to be considered necessarily a disadvantage: in recent years anti-trust authorities have blocked major industry mergers repeatedly (particularly cross-border ones); thus, being a smaller player makes Euronext a more natural buyer of available assets in Europe, compared to larger competitors.
4. Euronext Strategy & Business Model
The typical exchange business model is a natural monopoly with a winner-take-all market dynamic since orders tend to be concentrated in the most liquid market.
Euronext over the years has not only maintained its leading market share in cash equities in its European national regulated exchanges (which today are 7 national exchanges, in 2014 were 4), but it also successfully diversified the group into other products such as derivatives, fixed income, FX, Power trading, listings and most importantly post-trade activities.
This strategy has been executed through M&A and is aiming at reducing the group reliance on (i) volumes related activities and (ii) equity markets levels.
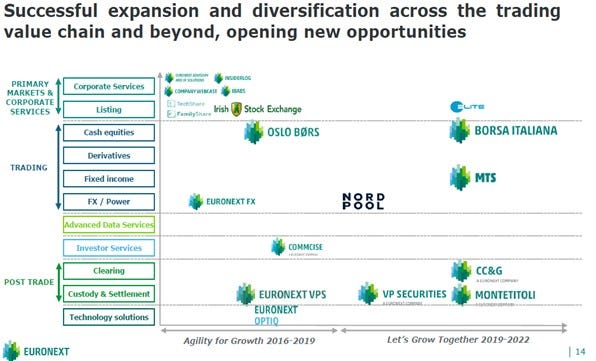
During the years 2016-19, Euronext expanded into:
Listings of debt, funds and ETFs through the acquisition of the Irish Stock Exchange;
FX and Power trading, as well as custody and settlement activities through the acquisition of Oslo Bors.
In 2019-22 the revenue diversification strategy progressed further with the game changing acquisition of Borsa Italiana, which brought with it:
A multi-asset clearing house;
A fourth central security depository based in Italy (Monte Titoli);
The leading European government bonds trading platform (MTS);
A 7th national equity exchange with a particularly high retail market participation (higher margins, 15% of volumes).
In terms of the group strategy going forward, at the 2021 Investor Day management emphasized five business priorities for the group for future years:
Leverage the integrated value chain: following the Borsa Italiana acquisition Euronext for the first time is able to control the entire post trade offering thanks to the internalization of Borsa’s multi asset clearing house and will no longer rely on LSE’s LCH clearing business for its cash and derivatives clearing.
Pan-Europeanise Euronext’s CSD network: through Borsa Italiana, Euronext acquired a fourth CSD in Milan which it integrated with its existing portfolio of CSDs (Porto, Copenhagen and Oslo) under a unified product offering branded Euronext Securities.
Build upon leadership in Europe: aiming to be the leading gateway for listing equities and debt in Europe and becoming the international listing of choice in the European continent.
Empower sustainable finance: via (a) committing to lower emissions to 1.5 degree trajectory and (b) develop products/services to drive forward the European decarbonisation plans.
Continue to deploy excess capital via executing value creative M&A transactions.
6. Divisional Review
Below I review the different revenues reporting lines to better understand the businesses in which Euronext is involved.
Trading revenues (34% of group)
Within this division, Euronext reports cash equities trading revenues, together with fixed income, power trading, FX and derivatives trading; it is useful however to look at these separately, given different levels of maturity and competitive dynamics.
Equity Trading revenues (19% of group).
Euronext Cash Equity trading business has a diverse client base made up of retail investors, investment banks or regional banks and brokers, with a deep presence in its 7 domestic markets.
As of the end of 2021, Euronext had 216 direct trading members on its cash business.
All of Euronext cash equity trading venues operate and rely on an inhouse scalable trading platform called Optiq that is able to offer a single orderbook across all of Euronext markets.
Optiq is attractive for market participants who can gain direct access via one single connection to deeper liquidity and a single unified orderbook for all 7 national exchanges on the platform; this is important because:
Smaller clients benefit from significantly increased access across different countries/markets.
Larger established institutions (such as an investment bank for example) benefit from having to deal with a single technological platform as opposed to using different providers for each of the 7 national exchanges.
The Optiq platform provides Euronext with economies of scale when onboarding new markets: for example moving Borsa Italiana volumes on Optiq will lead to immediate cost savings as it will switch off the LSE software it is currently relying on.
As previously mentioned, the cash equity trading business attracts most of investors and sell-side analysts’ attention and concerns, even though today it accounts for only 19% of the group (compared to 36% at IPO in 2014).
This is because it is generally considered an inferior business to derivatives trading as it is far more competitive and slower growth:
Indeed, cash equity is a straightforward mature product, easily tradable on many different markets and whose clearing is rather commoditized (usually on T+2 basis).
By contrast, derivatives are far more complex products, less mature and growing, and less easily tradable; most importantly, derivatives clearing is a natural monopoly where it is very difficult to disrupt the incumbent as market participants tend to concentrate their trading on one venue to minimize their capital commitment (in the form of collateral).
Notwithstanding the competition in recent years from alternatives cas equity trading venues, such as MTFs and Dark Pools, Euronext cash equity business fared well, with stable yields and resilient market shares well above the 60% level since 2016.
In a recent educational presentation on the business available on the investor relations website, Euronext management explained that the resiliency of its cash equity trading yield has been driven by:
The intelligent onboarding of new markets under various Euronext pricing schemes, and
The intensive customer segmentation strategy aiming at extracting maximum yield from different underlying flows (retail and local brokers are charged very different fees from quant funds for example).
Nonetheless, it is worth mentioning that competition remains intense in this business, particularly from CBOE Europe who has gained significant share since 2020; having said this, CBOE share gains appear to have primarily come via lower pricing and crucially lower profitability; it is therefore questionable whether this aggressive strategy is sustainable in the long run.
Taking a long-term view, there’s one important feature that is likely to allow Euronext cash equity business to remain more resilient than most investors think. This is due to the monopoly-like position Euronext markets have in the closing auction across Europe (where average trade sizes are ten times compared to trading in the continuous session).
The closing auction is a market mechanism at the end of the trading date where traders meet to guarantee orders being filled. In the last decade, there’s been a huge rise in closing auction volumes, as passive instruments have grown across Europe.
It is also worth remembering that European regulators tend to have an adverse view of less transparent trading venues such as Dark Pools compared to lit national exchanges.
Thus, in conclusion, whilst alternative venues (e.g MTFs/Dark Pools) to lit national exchanges may deliver lower headline prices to certain market participants, in reality overall trading costs on these platforms are higher compared than on-exchange where spreads are far tighter and liquidity is much deeper.
Non-Equity Trading revenues (15% of group)
The remaining part of the trading business operates across different and more complex products, such as derivatives (primarily equity and index products), fixed income (primarily through MTS the leading dealer-to-dealer European Government bonds trading venue) and to a smaller extent FX and Power.
Euronext’s derivatives trading business has a solid position in futures and options on benchmark indices and single stocks and it ranks second amongst European exchange groups in terms of open interest of derivatives traded as of 2021.
Derivatives trading is a faster growing business because volumes have grown much faster than cash products since the financial crisis of 2008/09, due to increased investors sophistication vis-à-vis risk.
In addition, because derivatives markets can be less liquid, traders tend to favour the incumbent as they do not want to spread their margins call on too many platforms; thus most markets tend to be oligopolies (and often even duopolies vis-à-vis the European market leader Eurex owned by Deutsche Börse).
Among non-cash equity trading revenues, one of Euronext’s most promising product is MTS, the leading regulated electronic platform for European wholesale government bonds and other types of fixed income securities, with over 500 unique counterparties trading c.€140 billion (notional) per day.
This asset was acquired as part of the Borsa Italiana transaction and is the #1 platform in Europe for fixed income trading revenues for Dealer-to-Dealer European government bonds trading and #3 for Dealer-to-Client trading.
MTS was an orphan asset within the LSE and Euronext intends to expand the business via better geographical reach across Europe.
Considering that electronification of bonds is around c.50% vs c.75% for cash equities, there should be good growth opportunities for MTS going forward.
Post-trade revenues (25% of group)
The Post-trade business can be split into (a) custody and settlement revenues originated by Euronext’s 4 owned CSDs and (b) clearing revenues, which should increase significantly following the acquisition of Borsa Italiana’s multi-asset clearing house.
Let’s first briefly explain the difference between a CSD (central security depository) and a CCP (central clearing counterparty or clearing house):
The former intervenes at the final layer when ownership of the securities is transferred, thus a CSD is primarily concerned with operational risk. In layman terms CSDs allow for the easy transfer of ownership of securities in electronic form: they are custodians where brokers and financial intermediaries hold their securities so they can be available for clearing and settlement.
A CCP intervenes between the stock exchange (or another trading platform or OTC) and the settlement layer, acting as a buyer to every seller and as a seller to every buyer and managing counterparty credit risk. CCPs are crucial market infrastructure assets as they allow counterparties to trade with each other anonymously without worrying about whether their counterparty will honour the trade; in addition, in the event that a counterparty goes bankrupt, a CCP allows the market to continue trading without the bankruptcy spreading to the rest of the market.
Euronext owns and operates four national CSDs venues in Europe (in Portugal, Denmark, Norway and Italy), and one multi-asset clearing house based in Italy.
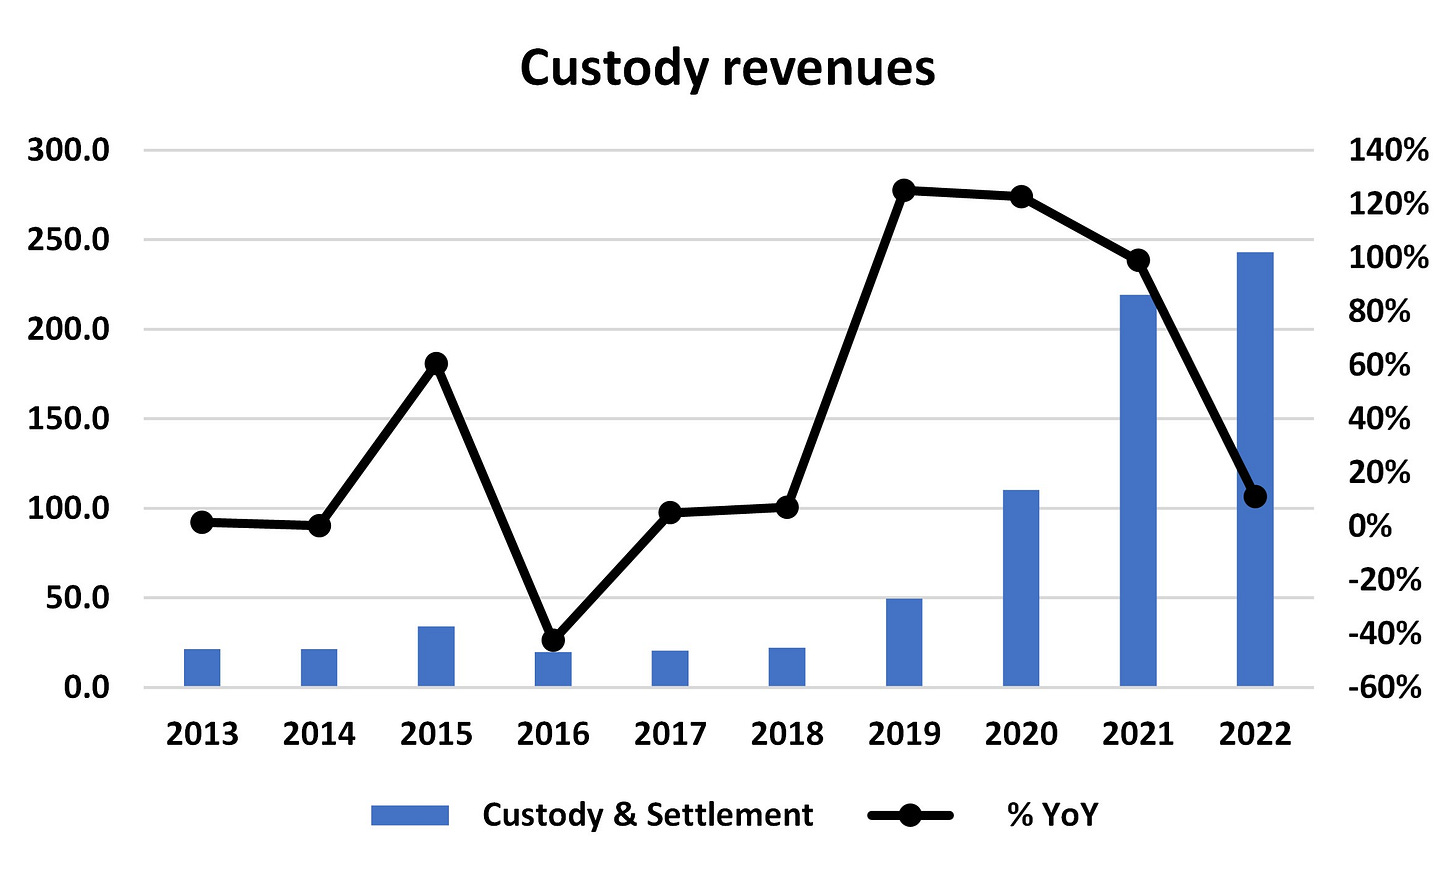
Custody & Settlement revenues (17% of group)
In 2021, Euronext unified its 4 owned CSDs into Euronext Securities, the 3rd largest CSD operator in Europe, serving 400+ clients, looking after €6tn in assets under custody and operating 120mn+ settlement instructions yearly.
Because different domicile have different custody rules, the regulation in Europe is bizarrely fragmented; however it seems that in the long run they may well be unified and Euronext appears ideally positioned for such change given its diversified geographical reach.
What is attractive about CSDs is that their revenue model is relatively resilient as it is primarily a function of the overall level of assets under custody, which tends to be sticky because any change can be disruptive.
Furthermore, the net interest income component of revenue in this business earned on cash balances held should benefit from rising interest rates in the coming quarters.
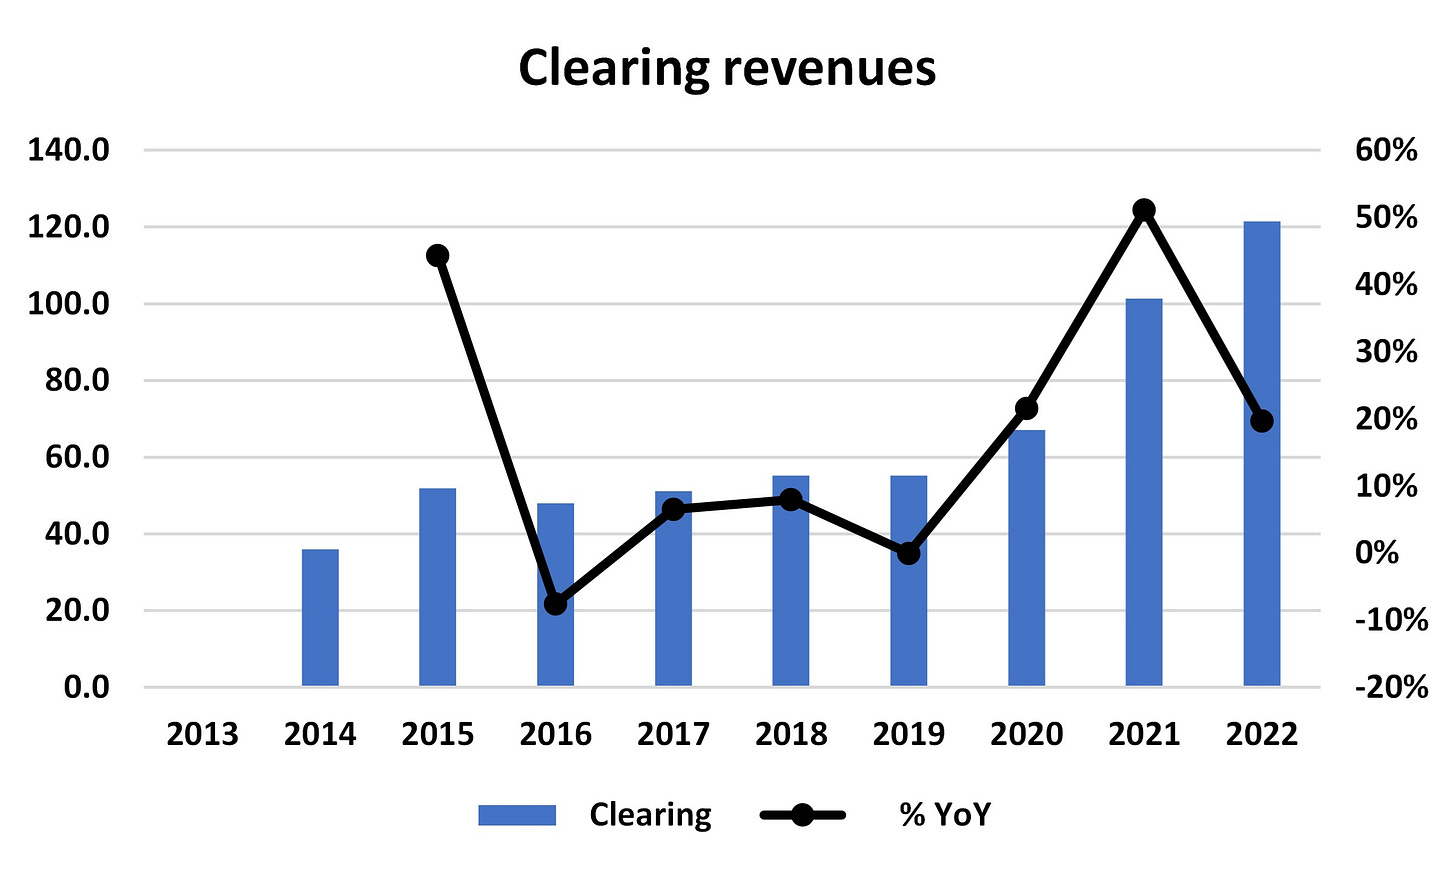
Clearing revenues (8% of group)
Until the acquisition of Borsa’s CCP in 2021, Euronext did not have its own inhouse clearing house; it relied instead on a 10-year agreement with LCH SA (owned by LSE) for the provision of clearing services on Euronext derivatives markets; under this arrangement, Euronext and LCH had a revenue sharing agreement dependent on the volumes cleared through LCH.
In Nov-2021, Euronext announced that it will establish its own clearing house (branded Euronext Clearing) as its CCP of choice for all of its cash equity, listed derivatives and commodities market.
This change is very important as it will allow Euronext to internalize the revenue leak that historically accrued to LCH ( the partnership with LCH will be terminated from March 2023 at a cost of a one-off fee of €36mn).
Furthemore, post Brexit, it is likely that European regulators will continue to demand higher levels of euro-clearing activities within the Eurozone, thus providing a tailwinds to this newly formed business (“The Commission plan to come forward with measures to reduce excessive dependence on systemic third-country CCPs, and to improve the attractiveness of EU-based CCPs while enhancing their supervision” – extract from EU press release Feb 2022).
Listing revenues (15% of group)
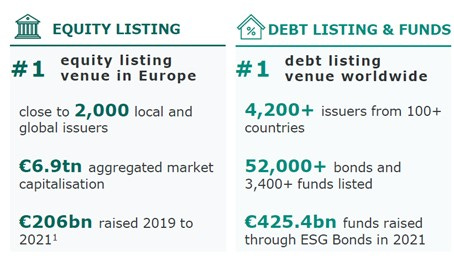
Euronext operates the leading European primary market venues as is #1 for equity listing in Europe but also #1 for debt instruments listing worldwide, thanks to its acquisition of the Irish Stock Exchange back in 2018.
Whilst overall listing revenues are cyclical, as they are tied to level of activity in capital markets, part of listings fees are more recurring in nature as they are generated through annual listing fees charged to issuers (30% of the divisional revenues) and public markets services such as webcasting for example (worth another 20% of divisional revenues).
Although Listing is a competitive business, Euronext is the market of reference in Europe: for example, leading European corporates must be listed on one of Euronext national markets in order to be included into indexes such as the French CAC for example.
It is also important to flag that Euronext Listing business isn’t exclusively focused on equities, but it also has a strong listed bonds and ETFs offering.
In the last couple of years, Listing revenues clearly benefited from strong fundraising; regulators are trying to keep the momentum going and one of the aims of the European Capital Markets Union legislation/project is encouraging more public listing and a more vibrant European capital markets ecosystem.
Advance Data Services (16% of group):
There are two businesses reported within the Advance Data Services revenue line, (1) indices/benchmarks and (2) the sale of real time data to external vendors (for example to Bloomberg and Reuters).
Overall, these are very good high margin businesses, generating sticky recurring revenues via subscription fees; furthermore, they both grow both via new product launches and increasing prices.
The data business is the larger component within the division and caters to over 450 vendors, which then disseminate Euronext market data to approximately 230,000 screens in over 120 countries.
The index business is smaller and owns a portfolio of c.1,500 benchmark indices and “iNAVs ”, including the important CAC 40® index in France and AEX® index in the Netherlands; having said this, it is fair to say that Euronext indices business is smaller and more regional in nature than the ones owned by leading global players MSCI, FTSE-Russell and S&P. Nonetheless, Euronext launched a significant number of new products and in particular is aiming to become a leader in ESG indices in Europe.
Market Solutions & Others (8% of revenues)
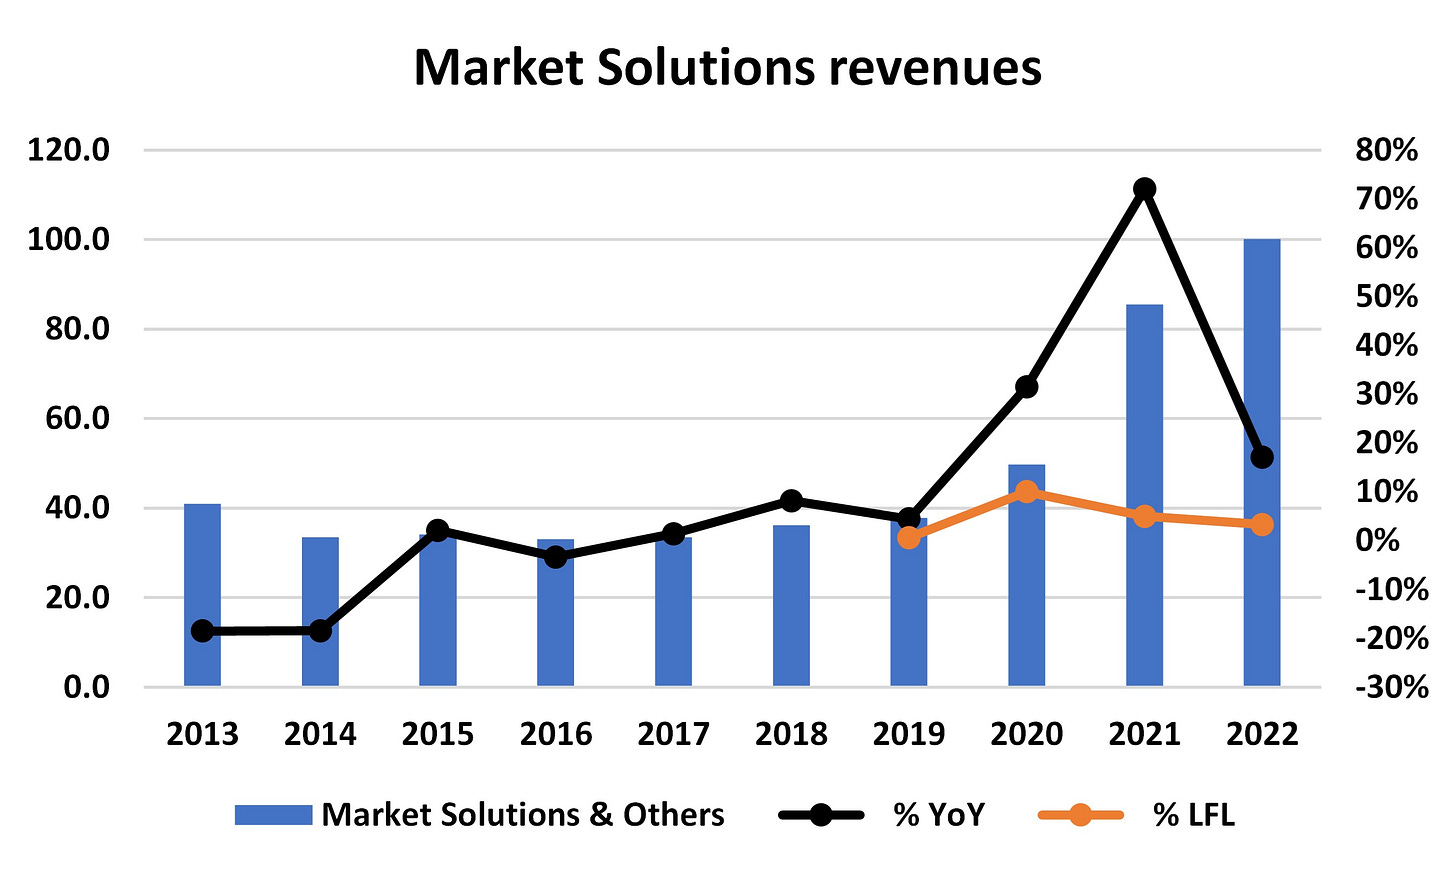
The Market Solutions business sells software and connectivity capabilities to market participants; it generates recurring revenues that are not trading related and less cyclical.
Historically, revenues from the Euronext Technology Solutions business came primarily from software licences and maintenance fees from trading venues requiring connectivity services and exchanges-related software.
Following the Borsa Italiana acquisition, Euronext acquired Gatelab and X2M, two businesses selling software to other financial institutions such market-makers, price-takers and brokers.
A large portion of divisional revenues are generated via so-called Colocation, which in layman terms consists of renting out exchange datacenter space to market participants requiring low latency (think of Citadel or large investment banks).
Another part of divisional sales comes from the sale of financial software (think of pre-trade, trading, and post-trade operations across venues and asset classes) to market participants; this is a more competitive business due to the sophistication of traders and the rapidly changing nature of trading technologies.
7. Management & Remuneration policies
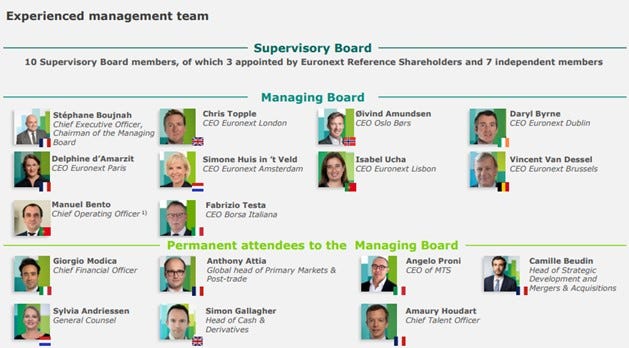
Euronext has a two-tier governance structure with a Supervisory Board and a Managing Board.
The Supervisory Board consists of 10 members, 7 of which are independent; the three member of the board that aren’t independent were proposed by the Reference Shareholders (see last paragraph) who as a group hold more than 10% of the company’s shares.
The Managing Board is responsible for the day-to-day management of the operations and is supervised by the Supervisory Board; the management Board is made up of the group CEO, group COO, Head of Global Sales and the CEOs of each local national exchange part of Euronext.
Group CEO and Chairman of the Managing Board - Stephane Boujnah:
First appointed in 2015 and reconfirmed in 2019.
He has been the leading force behind the transformation of Euronext away from a primarily cash equity business towards a leading market infrastructure asset in Europe.
Prior to Euronext, Mr Boujnah covered several senior roles in investment banking at Santander, Deutsche Bank and Credit Suisse. He began his career in 1991 as a business lawyer at Freshfields and holds an MBA from INSEAD.
Group CFO – Giorgio Modica:
Was appointed in 2016, following a two-decade career as an investment banker.
Since 2011 he was an advisor to NYSE Euronext and then Euronext throughout the attempted combination with Deutsche Börse, the carve out of Euronext and its subsequent IPO.
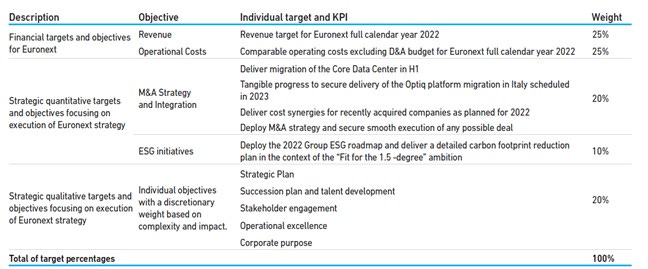
In terms of management remuneration, , there are three components to the CEO and Managing Board remuneration, ie annual fixed salary (AFS), short term incentives in cash (STI) and long-term incentives in the form of equity awards (LTI).
As per the table below, the STI component is awarded based on both quantitative and qualitative criteria based on:
Revenue target for the FY set by the Supervisory Board (25% weight);
Annual Opex ex-D&A (25% weight, equivalent to EBITDA);
Other non-quantitative criteria including M&A integration and ESG initiatives.
The LTI component is awarded based on equally weighted criteria of (a) TSR relative to STOXX Europe 600 Financial Services index and (b) 3-year rolling EBITDA growth target.
Overall, this set of incentives appears to be unsatisfactory as it lacks a ROCE/ROIC criteria, which is of paramount importance given the acquisitive nature of Euronext (although to be fair management has already demonstrated discipline on M&A in the last decade). It also lacks any cashflows measure, and I would prefer it not to be linked to TSR (I believe that good financial performance leads to rewarding TSR, whereas targeting TSR directly could lead to mis-steps).
Nonetheless, looking at the actual dollar quantum awarded to the CEO and Chairman over the last 5-years, the figures are rather modest if compared with US companies.
In my future interactions with the company I will raise these issues and hope the dialogue will foster some changes.
8. Financial Algorithm
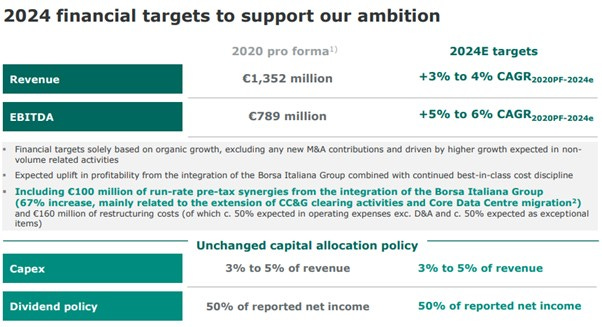
At the 2021 Investor Day, management provided financial guidance covering the period 2020-24, pro-forma for the Borsa Italiana acquisition, which primarily calls for pedestrian organic growth of +3-4% and EBITDA growth of +5-6% p.a.
These targets appear conservative/modest, as (a) in the last 5 years the company delivered better organic performance and (b) they do not include any growth coming from M&A, which is highly unlikely given the acquisitive strategy.
Looking at group historic performance since IPO in 2014, Euronext delivered:
+14% CAGR revenue growth and +18% CAGR EBITDA growth.
+12% CAGR reported EPS growth and +11% CAGR FCFE/share growth.
The group ended FY22 with a moderate leverage ratio (net debt/EBITDA of 2.4x) and FCF conversion averaged 90% over the last 5-years.
9. Capital Allocation
As visible in the charts below, excess FCF funded first a generous dividend (light blue area) with pay-out set at 50% of net income, and then the balance was deployed into M&A.
Euronext acquisition strategy begun with the roll up of different European exchanges, but really has been targeted to specific companies which brought with them assets that diversified Euronext away from cash equity trading:
Irish Stock Exchange, acquired in 2017, is not just an equity venue, but also the largest listed bond exchange in the world.
Oslo Bourse, acquired in 2019, brought with it an important post-trade business.
Borsa Italiana acquired in 2019 is a great asset that offered both cash and derivatives clearing at scale in the Eurozone, plus MTS, that is an important European fixed income platform (for context, there are very few fixed income assets available for sale across the industry).
Furthermore, what is noticeable about Euronext acquisitions is that they were mostly integrated on time and with significant more synergies than initially planned; this is particular visible in the case of the Borsa Italiana acquisition, where synergies so far are running at nearly double the initial estimated level of €60mn.
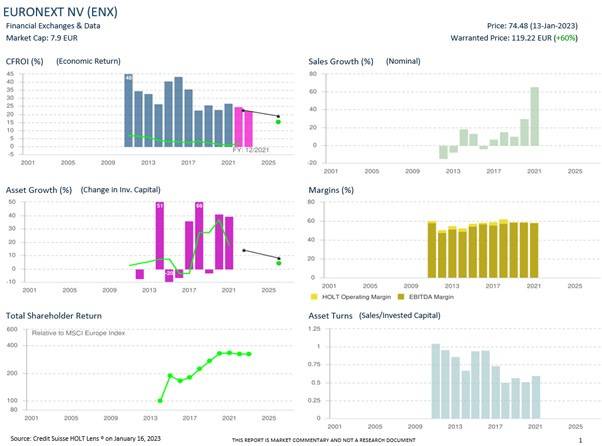
Importantly, the deals consumed since IPO have not impaired the company’s returns, as evidenced by the solid CFROI of the group shown in the CS HOLT chart below.
Presumably, the fact that group CFROI remained steady is due to the strict criteria set up by management for potential deals, which are sensible both strategically and from a financial standpoint; indeed all potential transactions:
Need to deliver a ROCE>WACC in years 3 to 5.
“Are expected to contribute to higher organic revenue growth, provide scalability and/or improve exposure to non-volume-related businesses”.
Note Euronext is truly well financed, with €3.0bn of debt on an average maturity of 7.9 years and paying an average fixed coupon of 0.9%.
At the recent 2021 Investor Day management emphasized that European consolidation isn’t over and highlighted that future areas of interest will be primarily in post trade services and investor services. Indeed, in Feb-23, the group made a surprising bid for AllFunds, a B2B fund distribution platform for €5.5bn, which was however retired one week later.
AllFunds is an attractive assets, it is a fund distribution platform that grows at double digits organically and earns high margins (>70%) with high recurring revenues business model and high retention rates.
The potential transaction didn’t seem to be appreciated by the market, as Euronext sold off c.10% on the day; however I note that acquiring AllFunds would have not only further reduced the share of cash equities at Euronext to c.15% of group revenues, but would have also elevated structurally the organic growth profile of the group by c.200bps.
The flipside is that the potential synergies from the deal would have been presumably low, and the large price tag would have required significant equity issuance given Euronext’s B/S constraint (management wants to maintain its investment grade rating).
I would expect M&A to continue to be a core part of the strategy in the coming quarters and years.
10. Historic TSR
Despite being considered an “inferior/minor” exchange, Euronext delivered the best TSR amongst its global peer group since 2014.
TSR over 2014-22 averaged c.+21% and could be roughly be split as
+15% CAGR in EPS,
+1% from re-rating and
+3% from dividend yield.
11. Valuation and IRR
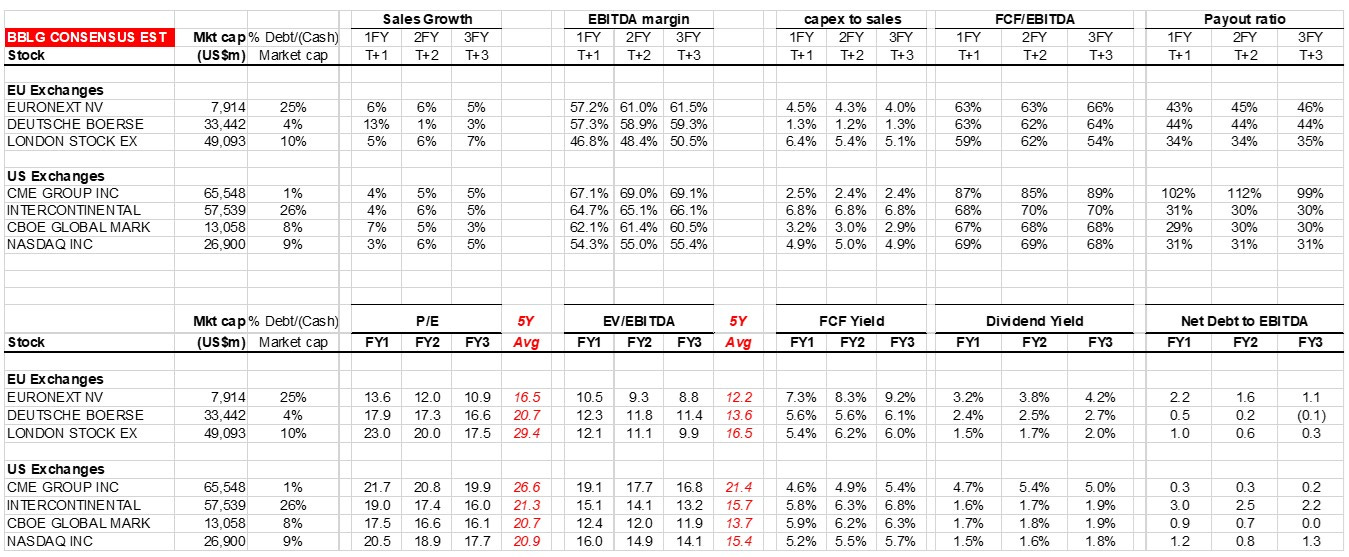
At the current share price, Euronext is the cheapest exchange on most valuation metrics, trading on 14x P/E vs sector average of c.20x.
This discount is likely due to the slower organic growth, considering that Euronext has similar margins, FCF/EBITDA conversion and capital intensity to its peers.
Furthermore, non-transactional revenues at Euronext have reached 60%, ie. similar level to Deutsche Börse, which trades on 18x P/E.
In light of these observations, I estimate a potential IRR of mid-teens over the next few years, assuming the group grows earnings by c.9-10% and the stock re-rates back to its long-term average P/E of c.16x.
12. Shareholders
Caisse des Depots et Consignations (7.8%) and CDP Equity SpA (7.8%) are respectively French and Italian state-owned enterprises; together with Euroclear (4%), SFPI FPIM (3.1%), Intesa SanPaolo (1.5%) and ABN Amro Bank (0.5%) they are considered reference shareholders and account for 23.81% of the registry.
Worth noting “Quality” investors MFS and Capital Group as the two largest independent institutional shareholders.















This was a really good write up and breakdown.
Fantastic research mate. Thanks for sharing. Keep up the good work.